THE WORLD ECONOMY HAS A PULSE SPOT!
If you are going to INVEST, TAKE THAT PULSE!
FOR most of the past two decades the main measure of shipping costs has been used as a guide to what is happening to world trade. Insider economists know about this pulse spot. See:
http://australianpropertyforum.com/topic/9349744/4/
which is a clear picture of the current, JANUARY 2016 "SICK WORLD TRADE" A Crisis, reflected in how stock market is doing. China had 8 days in a row of free fall. Jan 2016.
See how the pulse fades ( shipping numbers sink) in SEPT 2008? Internat'l trade went way down. It tried to come back up after the BAIL OUTS but couldn't. Didn't. AND PROBABLY WON'T. What is that about? Just for a science experiment, YOU TAKE THIS PULSE every week. Just google-imges on this phrase:
"baltic sea freight index" --go look at it via GOOGLE IMAGES or BING IMAGES. Either. Push past picture of boats. You will see visual graphs. Select one and then the next, reading what they say on those sites.
According to the FINANCIAL TIMES REPORTER on CHARLIE ROSE tonight, the Baltic Index is the key to how the world economy is doing.
--------------------------article found--------
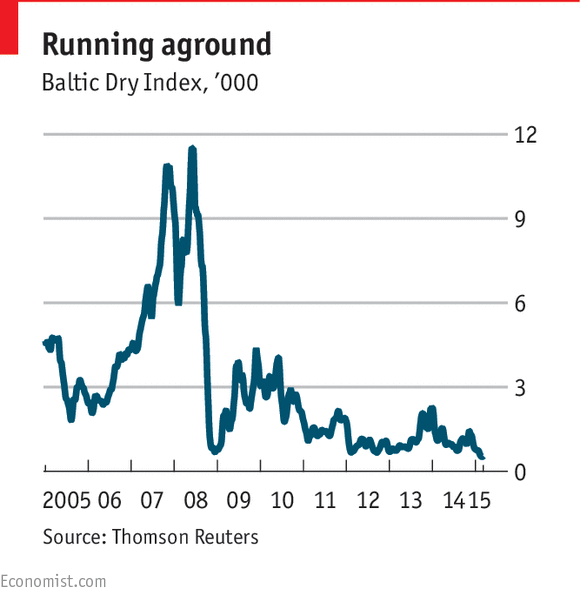
Why the Baltic Dry Index is at an all-time low
Mar 10th 2015, 23:50 by S.W.
THE Baltic Dry Index (BDI), which measures the rates for chartering the giant ships that transport DRY GOODS like iron ore, coal and grain, has long attracted the attention of commentators hoping to take the pulse of world trade. The cost of shifting the basic raw materials that are the ingredients of steel, energy and food supposedly provides a leading indicator of the state of the world economy. If so the forecast would suggest that a storm at sea will shortly make landfall. The index, a composite of rates charged on a variety of important trade routes, has hit an all-time low, after sinking by 65% in the past 13 weeks alone. Even in the depths of the financial crisis shipping rates kept their heads further above water (see chart). Why are they so remarkably low now?
There is no doubt that world trade is slowing down. China’s rip-roaring economy, the destination for well over half the world’s ship-borne iron ore and 25% of coal, has cooled. It grew by 7.4% last year compared to well over 10% when running at full tilt. But although the world economy is quite weak it is far away from the apocalypse that the index apparently foretells. The reason that the BDI has taken such a precipitous dive is that it is a measure both of demand for shipping and of the supply of vessels. Sliding charter rates are more a reflection of the eternal optimism of shipowners than a calamitous foundering of the world economy.
Episodes of short-term volatility are one way that the touchiness of the index to the vagaries of supply and demand manifests itself. The supply of ships is inelastic; it takes around two to three years between ordering a new vessel and its launch so the response to shifts in demand is slow and conditions can change while additions to the fleet are under construction. Even the location of ships can play a big role. If the number of cargoes on a particular route outweighs the available hold space on that route the index can soar, just as it can plummet if the opposite is true—even if worldwide the total of cargoes and ships is in balance.
The current malaise is much more a result of the overall supply of ships than a harbinger of doom for the world economy. In the run up to the financial crisis, as the world economy boomed and rates hit new heights, shipowners ordered a huge tonnage of bulk carriers. These hit the waves during the post-crisis slump that was already weighing heavily on demand for ships, which pushed charter rates lower still. Just as scrapping and a slimming of the order book was eroding the oversupply of ships, an uptick in Chinese coal imports in 2013 prompted another rash of orders. Ship owners reckoned that China’s appetite for coal would keep growing. But the country’s policy of weaning itself off dirty energy has contributed to a rapid decline in imports, leaving another glut of new vessels and rock-bottom rates for their owners.
Dig deeper:
The Baltic dry index has hit a 30-year low (March 2015)
There are growing doubts about what the Baltic dry is actually signalling (July 2010)
http://www.economist.com/blogs/buttonwood/2015/03/world-economy
<===BACK TO HOW TO INVEST